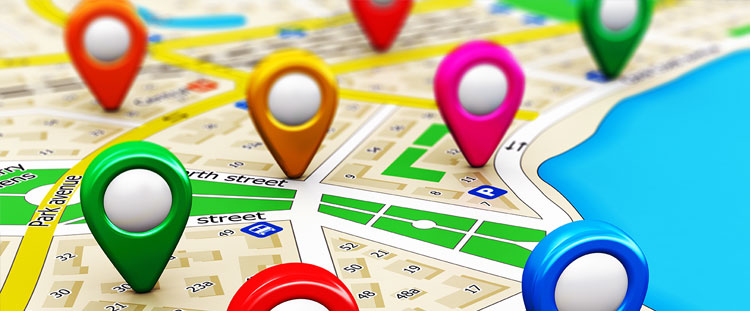
Earlier in our blogs, we discussed some of the key metrics for supply chain. An increasing issue in our field, however, is the compliance with relevant last mile delivery KPIs in urban legs and saturated cities, to improve performance, reduce costs and provide competitive advantage.
Urban deliveries are characterized by heavy competition and small margins and, according to academics from the University of Rome:
“Companies tend to focus on day-to-day service and are not able to take advantage of the innovations of ICT applications."
Are you overlooking last mile logistics solutions?
According to Supply Chain @ MIT, running a Megacity Logistics Lab, “companies can rethink megacity logistics with better analytics. If companies can find better ways to navigate the last mile in traffic-clogged big cities, they will open up new business opportunities in a vast and growing market.”
“To reach customers in these densely populated urban centers, companies must negotiate heavy traffic congestion, inefficient and ever-changing road systems, and a complex urban terrain. Also, urban markets in megacities are served by small retail outlets called nanostores, that need to be re-stocked frequently owing to a lack of back room space for inventory.”
Their research suggests that logistics and supply chain companies can do much themselves by taking advantage of data and analytical capabilities that are already available.
Why supply chain metrics are more than truck load capacity
It’s not just about the average load factors, the fuel consumption per unit and the average duration of deliveries, but analyzing comparatively how these are performing in different scenarios.
According to MIT professors Daniel E. Merchán, Edgar E. Blanco and Alexis H. Bateman,
“As urban population grows, these logistics operations must rely on already congested infrastructures, particularly the road and parking networks, adding layers of complexity to freight activities and worsening city externalities such as congestion, pollution, greenhouse gasses and noise."
For instance, the retail density of different megacities, regarding the number of stores per square kilometers, can be entirely different. In Santiago, Chile, the study found that retail could receive, in average, up to 4,000 daily deliveries in the city center.
In one day, in average:
- Food service companies can receive 10 deliveries.
- Clothing and fashion stores may receive 3 deliveries.
- Grocery stores may receive up to 9 distributions.
With these levels of rotation, given urban congestion, it´s important to measure how vehicles perform in many legs and routes. Andrea Campagna and Francesco Filippi, from the Centre for Transport and Logistics of the University of Rome, have studied how Information and communication technology (ICT) can solve the monitoring problem cheaply, efficiently and effectively via the internet.
Some of their work has highlighted "the reduced cost of the investment and the ease of collecting relevant data and using them to measure performance.”
A significant application of trip routing software in urban deliveries can help analyze the performance of vehicles not only regarding the overall trip length or speed, but to compare how urban and extra-urban legs perform comparatively, and their maximum and average load factors change. It can especially help revise empty travel or empty running, and the average duration of deliveries metrics.
According to the Italian academics, the average length of deliveries can not only provide indications of the efficiency of the operation but indirectly:
- On the good utilization of the cargo, as pallets require less time to be unloaded in comparison with the number of separated items.
- On the facilities available to place the vehicle near a point of delivery. Times required for parking, presence of dedicated space for unloading can be different, and waiting times due by poor synchronization of activities can differ.
“This implies that the operator will use a fleet monitoring system able to provide a daily detailed analysis of the performance of his vehicles not only to check service quality but also to identify inefficiencies to be removed”, they say.
By comparing and analyzing KPIs, they reach the conclusion that route optimization software solutions can reduce, for instance, the influence of the location of the depot in terms of time and full utilization of the vehicles.
In your opinion, what metrics are essential to improve urban deliveries and supply chain efficiency?
.jpg)

.jpg)